Did a quick scan through the IBD50. These are my favorites among them. HMSY, DLTR, NUAN, PNRA, DG, BWLD, HANS, SBNY, HUM, FFIV, TSCO, ALXN, VRSK, AAP and HCP. You can click on the chart to enlarge.
I wonder how often this kind of stuff really happens. We'll know that not many out there treat other's property as they do their own. If I saw this guy doing this while delivering to my house, I would be irate.
I've noticed a lot of frustration on the stream as of lately. The gaps whether they fade or trend seem to be difficult to trade and trust. I just wanted to mention a couple of things that have lead to a decrease in my frustration levels.
Once I noticed that many of my trades were being stopped out at a loss or trail stops hit in fairly short amount of time, I decrease the amount of trades I enter. This is also considering I feel my entry and stop placements are correct, following my strategy and rules for risk management.
I pass on a lot and become much more picky...Volume being the number one indicator I watch.
Depending on the size of the move I think the trade may make, I either drop my share size and widen my stop a bit, or tighten the stop all together. I prefer the dropping share size and widening stops.
Were not in a trending market yet. So to flip flop back and forth from bearish to bullish makes no sense IMO. Having unrealistic expectations of follow thru on either the long or short side doesn't make much sense to me either. While having potential trade set ups is just part of doing the homework like @ChessNWine mentioned in his video the other day.
Here are a couple of links for Day and Swing traders that may or may not help.
Weekly Butterfly. AB=CD Completes at 146.50, which also coincides with the D leg of this Butterfly pattern completing at the 1.618 extension. Looking to short the TLT at 145-146. Still a ways out.
@Patternprofits just posted a link by @GoldMoneyNews. So I thought I would take a another look at the $GLD chart. Check out this Link on Gold.Explaining Money supply will lead to accelerated inflation. Anyway, back to the chart of the GLD. Begining in May, it formed a Gartley long entry. While, I did not notice this earlier, the ideal entry was at the .786 retracement of the X to A leg at 151.62. However, trading the pattern you might have wanted to round up to 152-153, thinking it wouldn't retrace perfectly. Stop placement would be determined by your risk tolerance. While trying to catch a falling knife, it is probably prudent to keep a fairly tight stop. I will be keeping a close eye here to see if I can possibly get a second chance at this entry, my stop will be slightly under 150.00.
I was just thinking about the $VIX and this article on Yahoo somewhat answered my question. Check out the full article HERE.
"There is another possible explanation for VIX's seemingly strange reading. Many investors forget – or do not realize – that VIX only provides investors with a 30-day outlook on the U.S. stock market."
Possibly forming the right shoulder. The Measured Move on a Head and Shoulders is from the head to the neckline. I measure the first target from point of breaking the neckline, not through the high of the pattern, if that makes sense. That is just how I measure it. If this pattern completed, it would put the Spyders in new high territory, 138 area.
If the Inverse Head and Shoulders completes. This bearish weekly ascending wedge would be considered failed.
QQQ - Range bound and starting to reach the pinnacle of this triangle.
Kind of a random thought that popped in my head as I heard a Young Jeezy song on Spoify this afternoon. A couple of friends and I had grabbed a bottle of Crown and Absolute and a local Strip club on a Friday night. I think we might have been celebrating tax time, but I can't quite remember the cause for celebration. Either way, we were getting hammered, as we were pretty good at it. Strippers were everywhere, the club was packed.
We were having a great time. Having fun, strippers drinking and dancing with us. (Side note: I am not a lap dance kinda guy, I'd rather have the strippers drinking with us, listening to their made up stories is amazing.) There always seemed to be that turning point with us and our partying. A fork in the road I guess you could say, where the night continues, or it goes south...real quick. Well, this was sort of both.
At some point in the night, I walked up to go to the bathroom.I'm standing there taking a leak when this half bald, short pudgy guy walks up to use the urinal right next to me. Just weird. he starts talking to me about strippers, this that this that yadda yadda yadda. For some reason, he decides to tell me he is with the Memphis Grizzlies. Was I supposed to be impressed?
This is when I probably should've just kept my mouth shut. Who give a fuck I said. Athletes are a bunch of cock suckers. They treat people like shit and walk around like they own everything. Trust me I know, I've dealt with them all, I continue to rant. He started to get heated and I walk out saying, sorry buddy I stopped giving a shit about sports in the 6th grade.
I start dancing like a retard up the stairs to Go Getta, but before I made it to my table, I was surrounded by four of the biggest black guys I've ever seen. Ahh What the fuck, I keep dancing and try to make it thru two of them. Yeah, that didn't happen. I literally thought i was going to get my ass beaten right then and there. Due to the smoke and alcohol consumption, I don't remember the exchange of words, but what I do remember, is that they drank with us the rest of the night and picked up our 3k tab...While the little pudgy guy sat alone at the bar... Boom Bam
Some charts are holding key moving averages and support. Others look like shit. I see equally the same amount of long set ups as I do short set ups, at least in the 200 names on Quote list. The inverse ETF's even look like shit to me. I have moved away from day trading to swing trading in the last couple of years, personally. But this is a day traders market in my opinion. I don't feel comfortable holding on the long or short side at this time. For me Cash is best and all I can really do until something changes.
GLD AB=CD Still working on the C to D leg.
SPY Daily
Spy Weekly Ascending Wedge
Spy Monthly Range
VXX Triangle
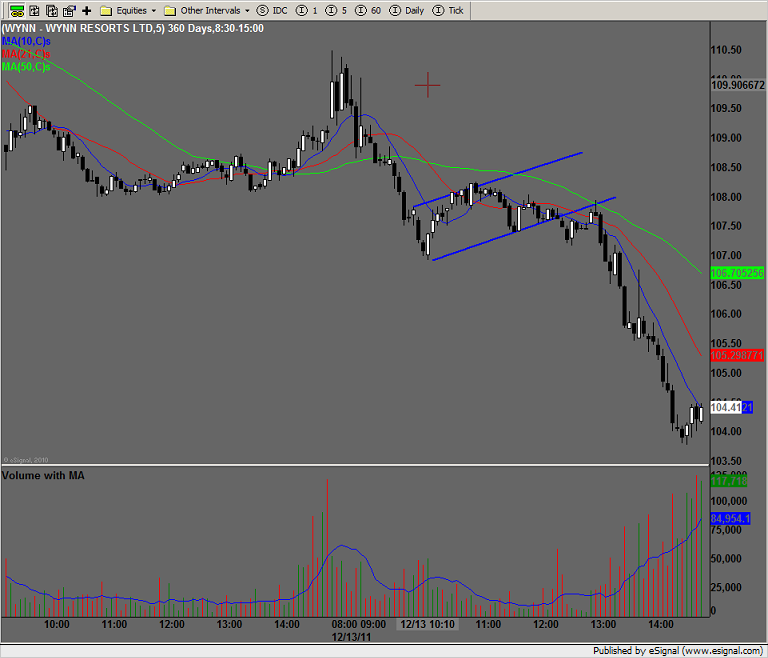
Fuck it, Day trading, I love trading the high beta names with big ranges. I prefer catching points on smaller shares, then cents on thousands of shares. My main monitor has the 1min, 5min and either a 30min or Daily, along with the level II and position manager. The other three screens are filled with the 5min charts of as many high betas I can fit.
Talking with @SteelerTrader this evening and it sounds like he prefers to use the first 15min range. I prefer the first 30min range. 9 times out of 10, I will sit on my hands the first 30min and wait for the range to develop.
I'm either short thru the first 30min low or long thru the first 30min high. On the 1 and 5min charts are what I love to day trade off of. I use almost the same moving averages as I do on the daily time frame and the same way, mainly as trailing stops. The idea is to use the 50 period in determining the trend and the 10/21 as trail stops.
To me there is no reason set targets, your just going to limit your upside. Why I use trailing stops. The most lucrative days for me are when stock trades down in the morning, sideways, then follow thru to the downside in the afternoon. I haven't day traded in almost two years so I could just be off my rocker, or it's just me missing trading 08. Obviously hindsight is 50/50. I just noticed some nice looking 5min charts today. If this bear starts to get some legs, I might just have to saddle up and start piking again. If that's the case I'll start hangin in @GtoToy'sChat Room.